


 CLSK

 CORZ

 HUT
 IREN
 MARA

 WULF
How to read a least-squares fit
Work through slope, intercept, R squared, p-value and the difference between a fit on filed levels and one on their logarithms.
Written by Dean Shalem, published , about 5 minutes to read.
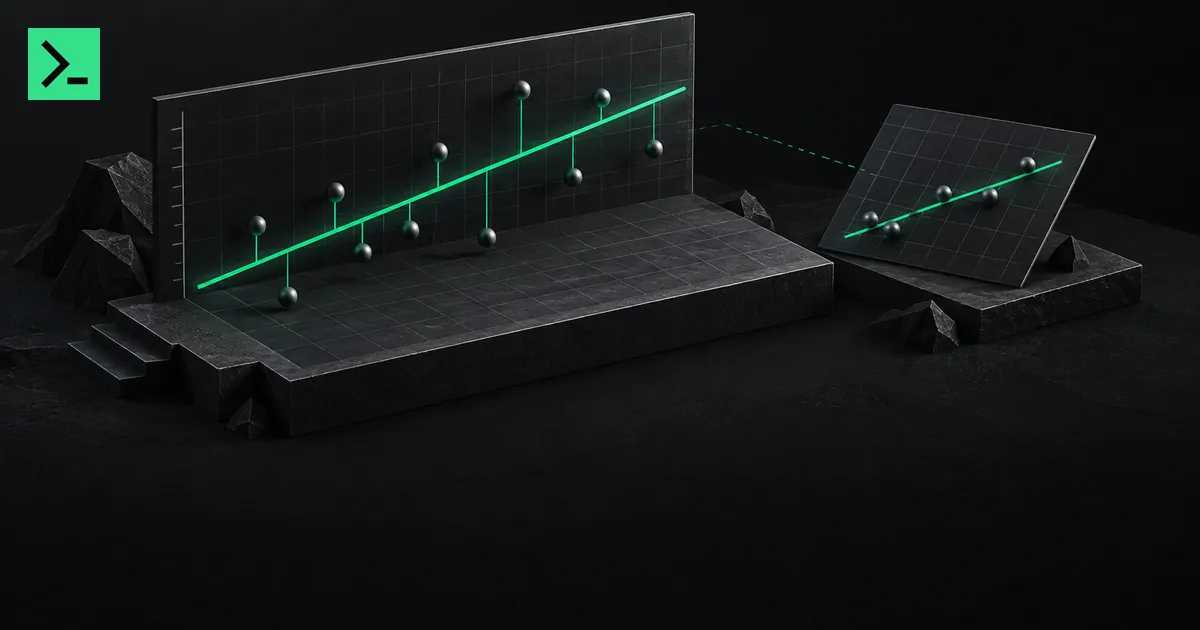
Work through the figures.
Revenue against realized hashrate
Latest comparable revenue and hashrate figures across the filed sample. As of Oct 14, 2026.
Method and sources
The fitted line rises with hashrate, but the worked example also tests whether company size is driving the relation.
- Covers
- latest comparable figures on file across 11 miners
- Unit
- USD per year
Source: MinerTerminal analysis, computed from the cited source data
| Company | x (EH/s) | y (USD per year) |
|---|---|---|
| BTBT | 0.4 | $128.5M |
| BTDR | 76.7 | $451.4M |
| CIFR | 11.6 | $99.3M |
| CLSK | 42.6 | $766.3M |
| CORZ | 15.7 | $656.8M |
| HUT | 28.1 | $299.7M |
| IREN | 23.2 | $707M |
| KEEL | 14.8 | $121.7M |
| MARA | 70.3 | $699.5M |
| RIOT | 44.4 | $696.9M |
| WULF | 9.3 | $179.1M |
| Least-squares fit | slope 6339033.721427, intercept 242676066.591543, fitted in levels | |
R squared is a share. It tells you what fraction of the total spread in one figure the line accounts for. The rest of the spread is what the line leaves behind.
We work on 11 miners, drawn from a universe of 18. Each miner is one point: realized hashrate on one axis, annualized revenue on the other. Two of those points are CleanSpark, at 42.6 EH/s and $766.3M a year, and MARA Holdings, at 70.3 EH/s and $699.5M a year.
On the figures as filed, the least-squares line has a slope of 6.34M US dollars of revenue per EH/s and an intercept of 243M US dollars a year. Its R squared is 0.33. The Pearson r is 0.58 and the Spearman rho is 0.65. If the population slope were zero and the test assumptions held, the two-sided p-value, 0.063, is the probability of a slope estimate at least as far from zero as this one.
A fit on levels can pick up size alone: a bigger miner has more hashrate and more revenue, and the line tilts. The page leads with the fit on the base-ten logs of both figures. Logging changes the scale and makes proportional differences comparable. It does not remove company size or other confounding. That fit uses 11 points with 9 degrees of freedom. Its slope is 0.365 and its p-value is 0.032. Below 8 points, a single company can move the result, and the page flags that.
Now the arithmetic, one line at a time.
The whole spread of the log of annualized revenue around its mean. We call it SST.
SST = 1.262
The spread the line accounts for. We call it SSR.
SSR = 0.527
The spread left around the line. We call it SSE.
SSE = 0.735
A check: SSR plus SSE gives back SST.
That is SST, 1.262, to within the rounding of the three figures.
R squared is the share: SSR divided by SST.
R squared = 0.527 / 1.262 = 0.418
That is the value the page carries: 0.42.
We split the total spread in the log of revenue into two pieces. The line takes one piece, SSR, and the scatter around the line is the other, SSE. R squared is the first piece as a fraction of the whole. It describes how much of the variation in revenue, on the log scale, the line through hashrate accounts for on this date. It is a description of the fit on these 11 points, not a rule that carries to other dates or other sets of miners.
Sources
- MinerTerminal analysis output used in the worked example
- MinerTerminal analysis formulas and source rules
- SEC company facts API for filed company figures
- NIST least-squares regression guidance
- NIST statistical methods handbook
Run the same figures on any company: the analysis page behind this example.